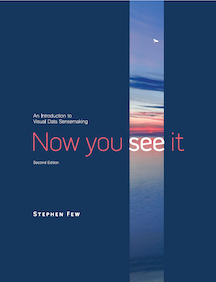
On April 15, 2021, my book Now You See It (2009) will become available in its second edition with the revised subtitle An Introduction to Visual Data Sensemaking.

Now You See It: An Introduction to Visual Data Sensemaking
This is more than a mere update. Essentially, this new edition combines the contents of the first edition with the contents of my book Signal: Understanding What Matters in a World of Noise. I wrote Signal in 2015 to complement Now You See It by covering more advanced data sensemaking techniques, including Statistical Process Control. And, in case you’re concerned that this new edition will be huge and heavy enough to serve as a doorstop, you’ll be pleased to hear that I’ve combined and refined the best of the two books into a single publication that is roughly the same size as the original version of Now You See It. This new edition will make the process of learning visual data sensemaking skills more fluid, efficient, and comprehensive.
Before you can present information to others, you must first make sense of it. Now You See It teaches the concepts, principles, and practices of visual data sensemaking. The skills taught in this book rely primarily on something that most of us possess—vision—interactively using graphs to find and examine the meaningful patterns and relationships that reside in quantitative data.
Although some questions about quantitative data can only be answered using sophisticated statistical techniques, most can be answered using relatively simple visual data sensemaking skills. No other book teaches these basic skills as comprehensively and in a way that is accessible to a broad audience. Even though these skills can be developed by anyone with eyes to see, they are not intuitive—they must be learned. Without these skills, even the best data visualization tools are of little use, and data will remain nothing but noise.


