


I’m a big fan of Power BI but that doesn’t mean that I’m not open to using different reporting and analytical tools in an enterprise modern data platform. People love Tableau with its long history as a leading visual dashboard and report design tool. Is Tableau an effective dashboarding and analytic reporting tool for a solution built using Microsoft Fabric? As I investigated this question for a new consulting client, my goal was to put aside any product prejudice I might have and approach the question with as little bias as possible.
Tableau led the self-service visual reporting revolution and now part of the Salesforce suite, it is bound to continue to have a loyal following and user base. The purpose of this article is not to compare Tableau to Power BI nor to expound on the strengths or perceived weaknesses of either product, but to share my experience and learnings about using Tableau with Microsoft Fabric and Power BI semantic models. I will demonstrate how to use Tableau with a Direct Lake semantic model, a large import mode semantic model and how effectively Tableau works securely with semantic model-based row-level security (RLS).
There are two different modes for using a Tableau dashboard for reporting on data in a Fabric lakehouse or warehouse: you can either import a copy of data into a Tableau workbook or you can directly connect to a published Fabric (aka Power BI) semantic model without making a copy of the data. My purpose is not to expound on the pros and cons of semantic modeling vs data ingestion but just to explain them. These two options are fundamental differences between the way that Tableau and Power BI developers think about using their respective products. Power BI developers, at least in the enterprise data space, are accustomed to the concept of first building and publishing a semantic model and then creating one or multiple reports connected to a centralized model. For most Tableau users, this “model first” concept is a paradigm shift; however, if you are on the Fabric bandwagon, you are probably already sold on the idea of creating one central highly efficient analytic model to surface your business data rather than creating multiple versions of the truth.
The Fabric (and previously the Power BI enterprise pattern) is to load reporting data into a dimensional model stored in a Fabric lakehouse or warehouse and then create a semantic model on top of that, containing all the measures and calculation logic. Whether using Direct Lake with native parquet-delta storage or Import mode doesn’t matter; the report/dashboard behavior will be about the same. The goal for this experiment is to load all data into a Fabric lakehouse or warehouse, build a central semantic model, expose it securely with row-level security (RLS) and connect reports and dashboards to the model so business users can only see and analyze data within the confines of their role. In my model, users can be assigned to any of three user roles defined in the model: Store Managers, Region Managers, and All Access. Store managers should only see POS transaction data related to their store and region managers should only see transaction data for the store in their assign state. Users in the All Access role can see all transactions. Data was generated using PySpark notebooks. The transaction data was created in batches to generate exactly five billion POS transaction records for a fictious burger chain with 400 stores in various cities and states and 5,000 cashier employees entering transactions. The point was to test performance with a substantial volume of data. With OneLake native parquet-delta column compression, the transaction data only ended up using about 15 gigabytes of storage space.
Tableau Connected to a Semantic Model
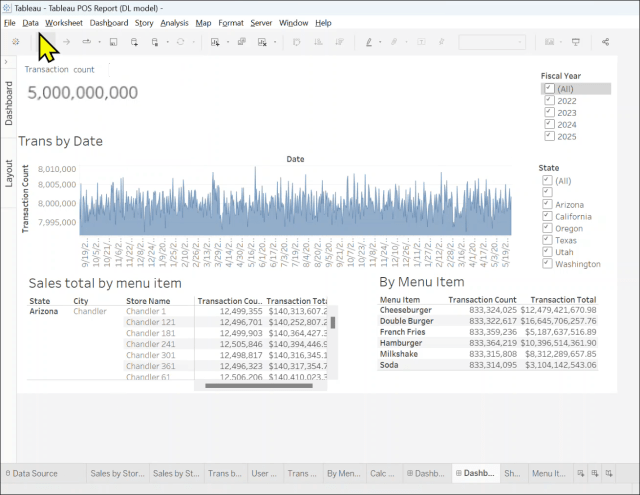
I’ll walk you through the entire solution but first, let’s take a peek at a Tableau dashboard connected to the semantic model ran by a user in an unrestricted role. As you can see, there are five billion POS transaction records viewable to the user running this dashboard. That’s data for all 400 stores in all states over 2 years of time.
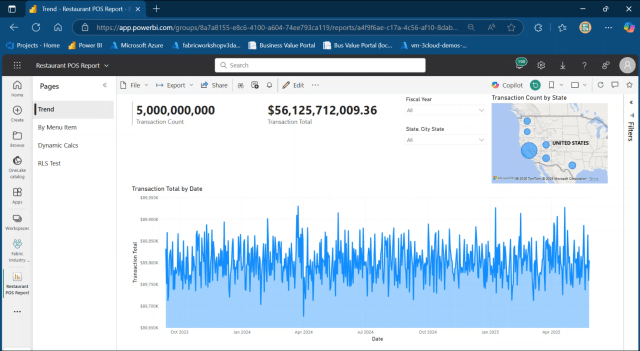
Here is a Power BI report connected to the same semantic model opened by the same test user in the All Access role. Same number of transactions and the same totals:
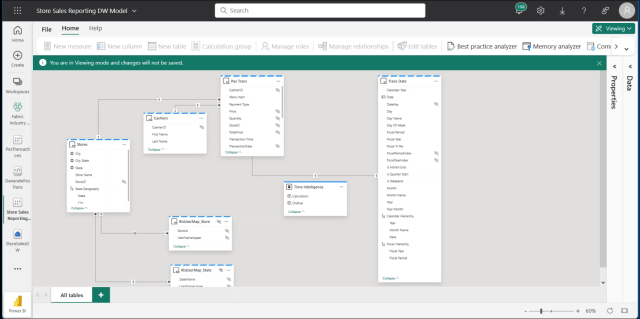
And here is the Direct Lake semantic model called “Store Sales Reporting DW Model” which is built using the Fabric warehouse called StoreSalesDW.
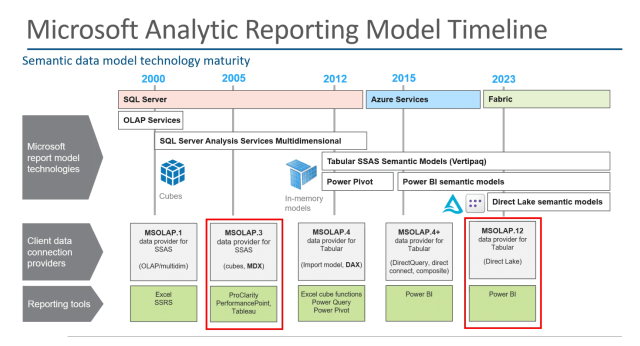
I’ll demonstrate the model design and RLS configuration, but first, it is important to understand how semantic model connections work and what to expect using an older tool like Tableau. This requires a short history lesson about how Fabric semantic models came to be and how Tableau can connect to them. The following diagram depicts the timeline of the Microsoft Analytic Reporting Model technologies. Microsoft released Analysis Services with SQL Server 2000 as a storage-optimized multidimensional database that stores structured hierarchal data in cubes. The query language for first-generation SSAS is MDX.
Tableau Connectivity to the Semantic Model is Different than Power BI
There are subtle differences between the Power BI and Tableau experience that are a product of the features of each product and the capabilities of the connectivity sack that were available at the time the product was developed. The client connection data provider and API stack for SSAS is part of the MSOLAP library, a component of the .NET Framework. Tableau initially implemented MSOLAP.3 in Tableau Desktop which defined the feature set supported by Tableau today.
What is the effect of using the old MSOLAP data provider in Tableau and how is the experience different from the newer data provider that is used for Power BI? When connecting, the data provider represents objects using the legacy SSAS metadata objects. It will be similar to what you see when connecting to a semantic model from Excel, which also uses the old data provider. Here are a few notable differences and terms that have changed in the past ~20 years:
| Newer Power BI/Fabric experience | Legacy MSOLAP.3 experience |
| Workspace endpoint address | SSAS Server name |
| Semantic model | SSAS Database name |
| “Model” | Cube name |
| DAX query language | MDX query language |
Compatibility Limitations and Considerations
When using the legacy data provider, RLS role users are required to be granted Build permission on the semantic model. This is not a requirement for Power BI users but is needed for anyone using Excel, Tableau or any other “legacy” reporting tool based on the old data provider. All RLS role users must also be members of the Viewer workspace role regardless of the reporting tool.
Tableau doesn’t understand hierarchies, so they just don’t show up in the field list. Certainly not a show-stopper because you can group data using multiple fields just like you can in Power BI instead of using a hierarchy.
Text type measures don’t seem to be supported. I’ve seen them work in some cases and not others, but they are generally problematic in my experience.
Newer Power BI features like field parameters and visual calculations are not supported by Tableau because they are implemented in the Power BI report rather than the model. Copilot and Q&A are also not available with Tableau. Calculation groups show up as a regular table and seem to work just fine.
The SSAS “Cube Server”
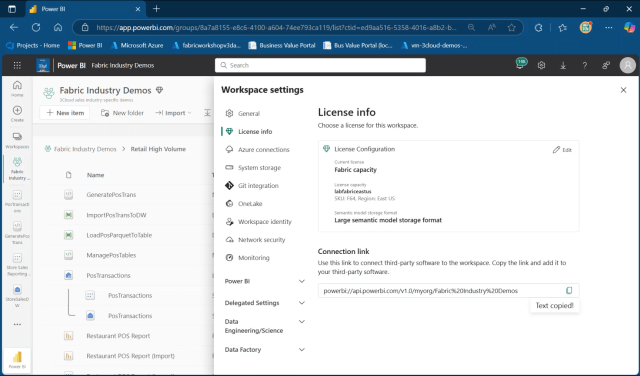
The connection in Tableau will prompt for the “cube server”. In Fabric, that’s the workspace webservice endpoint address or workspace Connection link. Navigate to the workspace in Fabric, go to the Workspace settings and copy the Connection link address from the License info page.
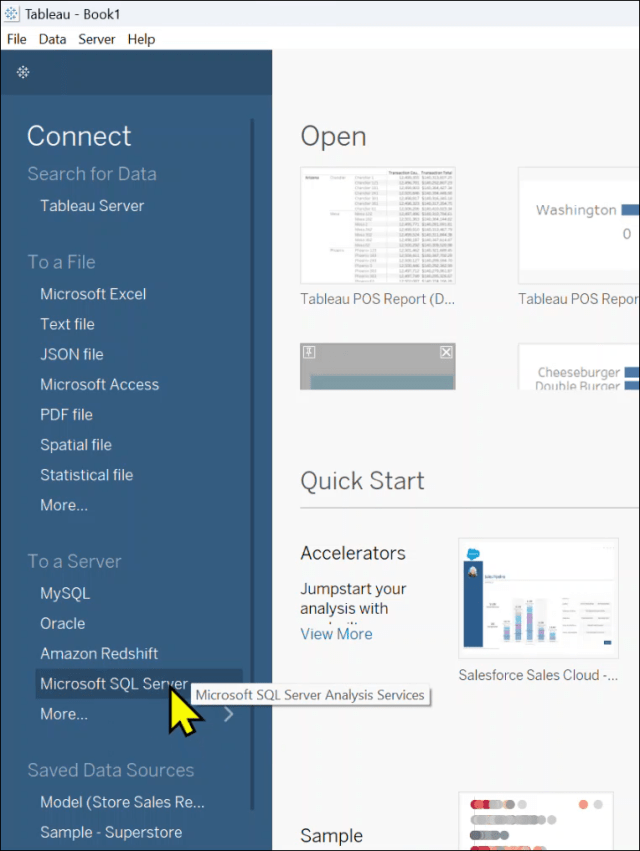
In this example, I’ve opened Tableau Desktop so I can create a new Tableau dashboard connected to the Fabric semantic model. In Tableau Desktop, I create a new connection on the “Connect” panel under “To a Server” heading, and choose Microsoft SQL Server Analysis Services.
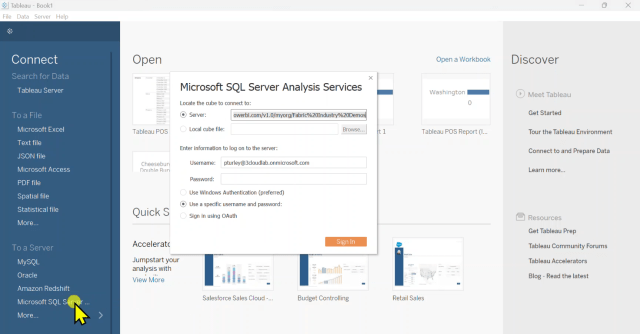
Paste the connection link that you copied from the workspace settings page into the Server box on the connection dialog.
Since Fabric uses Entra ID authentication, I’m signing in using my Entra (aka AAD) credentials like all of the other Fabric services. The dashboard user will be prompted for their credentials which will be used for data access and row-level security filtering.
In this example, I’ve already created and saved a Tableau book with connected sheets and dashboards. When opening the file, I’m prompted for my Microsoft/Entra credentials.
When creating a new project, after authenticating, I am prompted to select an SSAS database and cube from the SSAS server (webservice address) I copied in the earlier connection dialog. Again, the legacy data provider thinks you are connected to an Analysis Services server, so you just need to translate new objects to the old metadata object names.
Select the semantic model as the database. Every semantic model has a model named “Model” by default. That will be the only option in this list.
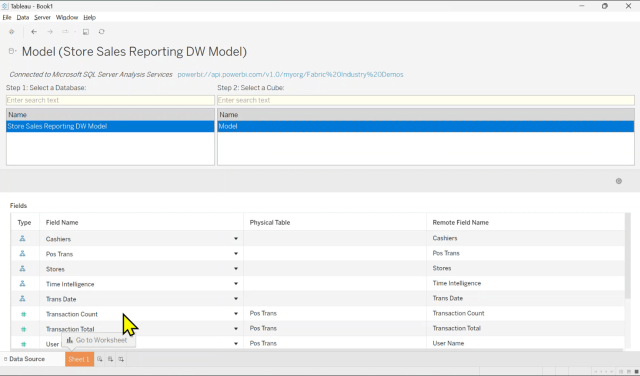
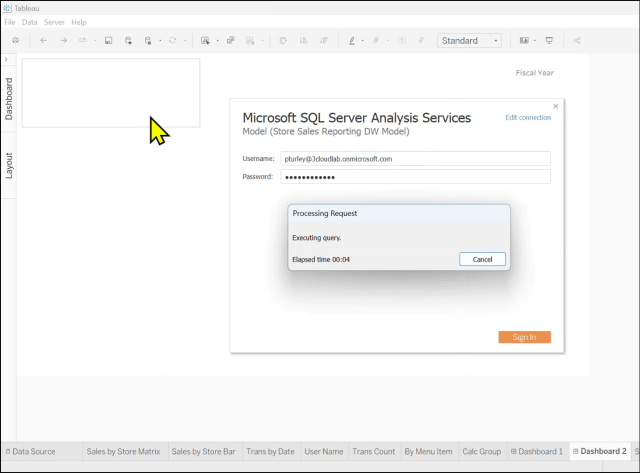
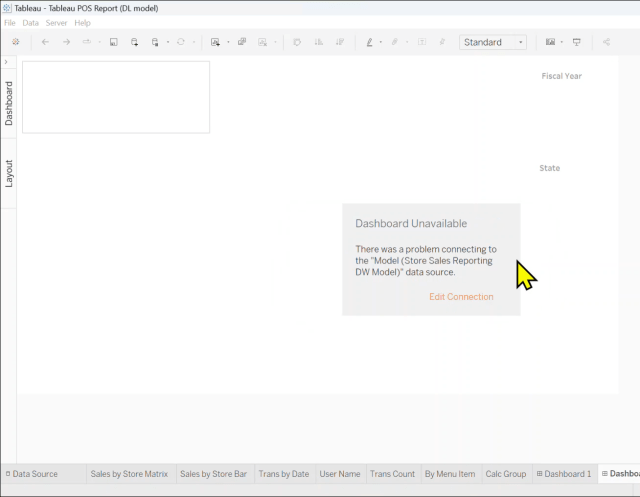
Tableau does have a habit of complaining while it is negotiating connections. If you see this message, give it a few seconds and the warning will go away after the connection is established.
Setting up Row-level Security (RLS)
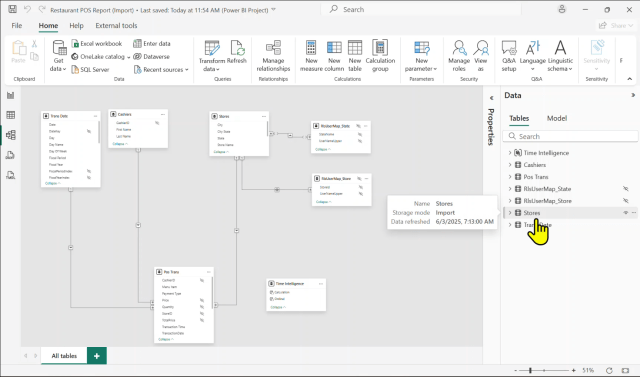
The next few steps apply to designing RLS in practically any Fabric solution, but this makes the point that dimensional design is essential for any semantic model in Fabric and Power BI, regardless of the intended reporting tool. Here you see that I have created two RLS mapping tables that are related to the Stores dimension table. In Fabric it is more important than ever to use proper dimensional modeling patterns because Direct Lake requires the RLS filters to be propagated through relationships rather than entirely using DAX code. I’ll explain this bit more in a few more steps.
Two RLS-user mapping tables are used to implement dynamic data-driven user-level filtering for members of two corresponding user roles: Store Managers and Region Managers. Both of these tables are related to the Stores dimension table. The RlsUserMap_Store table is related to the Store table based on the StoreId columns and the RlsUserMap_State table is related to the Store table based on the State name column. Because the State isn’t unique in either table, it must be a many-to-many relationship with a bidirectional filter.
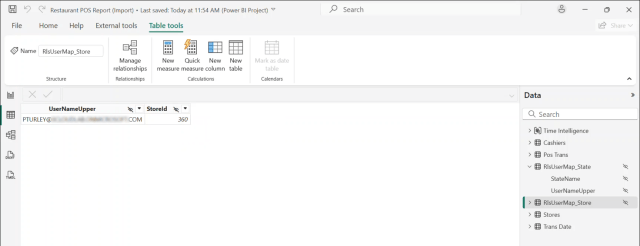
The RlsUserMap_Store table has two columns. The user name (email address) and the StoreId for transaction records that they should have access to. In a production scenario, this table would be populated with a record for every store manager user along with the corresponding StoreId.
The RlsUserMap_State table has two columns. The user name (email address) and the State name for stores and related transaction records that they should have access to. Again, this table would have many records in a production scale deployment.
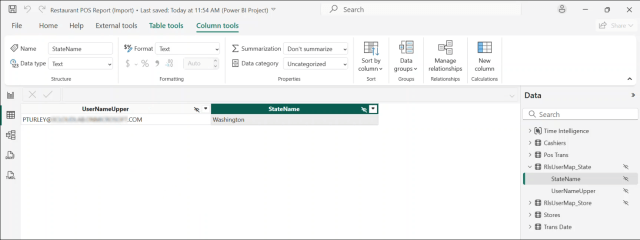
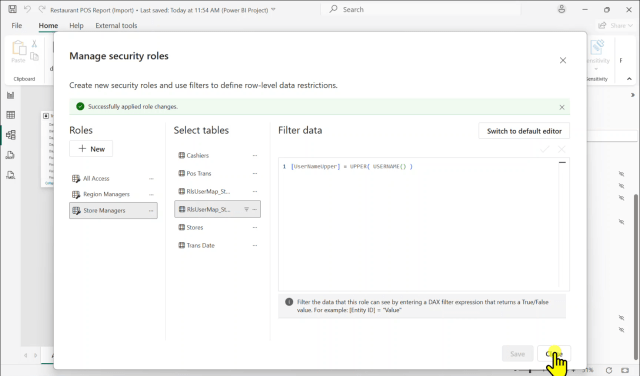
Here is the RLS filter for the Store Managers role. The RlsUserMap_Store table will be filtered to include only store records corresponding to the record or records matching the UserNameUpper field to the signed-in user.
A few things are unique to Fabric: Text value matching, as you can see, is case-sensitive so we store the user name in upper case and then convert the USERNAME() function value to upper case so there are no case mismatching problems. The other important consideration is that a model in Direct Lake mode cannot use any DAX functions in an RLS filter expression that summarize or aggregate values. This is quite restrictive, and it means that you can’t use functions like LOOKUPVALUE(), CALCULATETABLE() or SUMMARIZE() to apply creative filter logic. Therefore, you must build relationships to support the RLS filter rules.
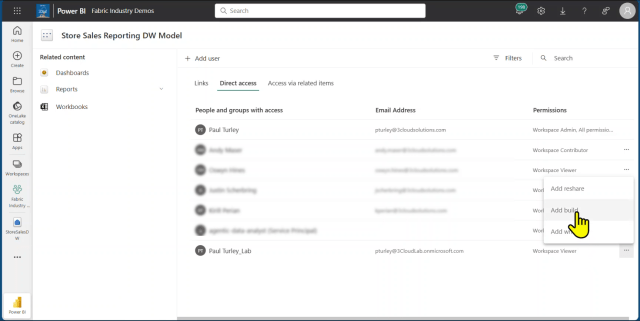
As I mentioned, Tableau uses the legacy MSOLAP data provider to multidimensional SSAS, so the user must have Build permission on the semantic model after making the user, or the Entra group to which they belong, a member of the workspace Viewer role. If the user has access to the workspace, individually or through group membership, with any other role access; RLS filters won’t be applied, and they will see all data.
Build Permission on the model
Why “Build” permission? At first, just based on the name, it seems like a lot of security access for a dashboard consumer to need “Build” permission, but it’s not. However, it is another step for administrators to perform when adding new users. To understand this, it might be enlightening to think about the state of the industry in 2005. At that time, it was uncommon for business users to create their own reports. If a user needed a new report, an IT professional would go “build” one for them. Right or wrong, whether or not that makes sese to you, Tableau users who use direct connectivity to a semantic model are required to have Build permission to the model.
Now the user or group they belong to need to be added to an RLS user role. In this example, my test user is a member of the All Access role. As you can see in the Power BI test report shown here, all 5 billion transaction records are visible along with related aggregate measure values.
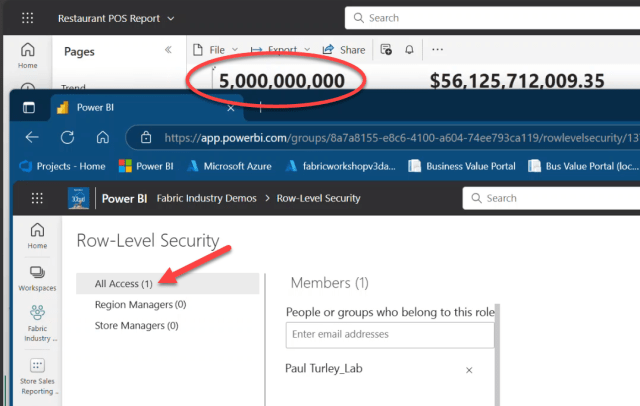
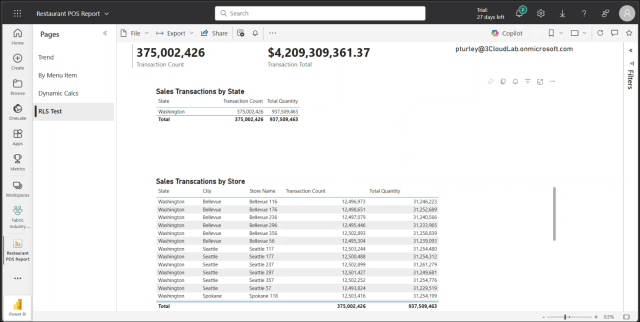
I’ll remove my lab account user from the All Access role and add it to the Region Manager role. After I click the Save button, the report immediately recalculates and shows only 375 million transaction records. Note that it might take a few seconds for the RLS filter to take effect after the report refresh is triggered, so just refresh the browser to make sure you’re not seeing cached values.
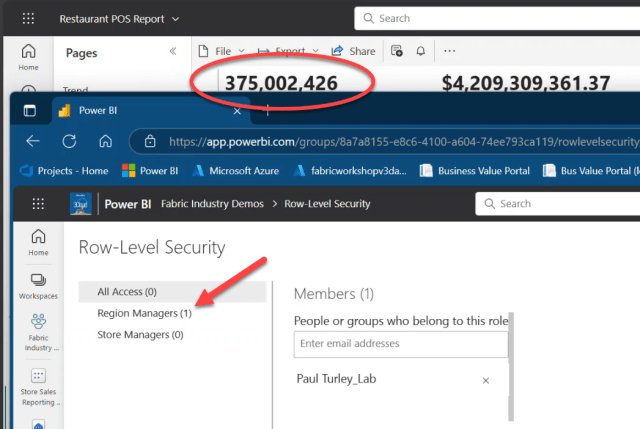
In this view, we see that I am able to view only stores within the state of Washington which explains the reduced Transaction Total amount.
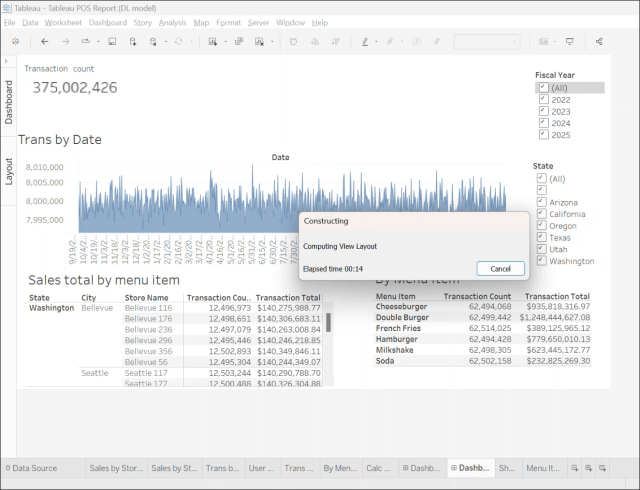
And now for the test using Tableau… This dashboard is similar in design to the Power BI report based on the same semantic model. I went through the same exercise of removing the user from the All Access role and adding them to the Region Managers role. After making the change, I can either refresh the connection or just change any filter, and all visuals update to reflect the RLS role assignment. Transaction Count changes from 5 billion to 375 million, and the two tables show only store data in the state of Washington.
A difference in behavior between Power BI and Tableau is that the whenever there is a filtering change of any kind on a Tableau dashboard, a status dialog displays the elapsed time. In my testing, even though the interactive query time against the semantic model (DAX queries from Power BI and MDX queries from Tableau) is pretty fast in both cases, the rendering time is a few seconds longer in Tableau. In this case, it took about 3 seconds to run the interactive query but 14 seconds to finish re-rendering the visual. That said, Tableau does the job with descent performance.
I’ll follow up in another post to compare the equivalent DAX and MDX queries generated by the two tools.
Calculation Groups
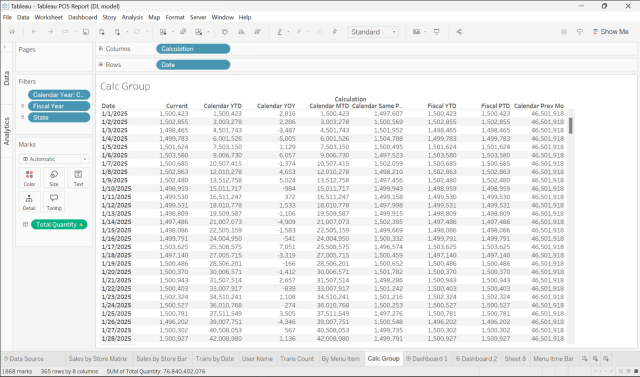
In an effort to push the envelope just a little further, I made a point to create a calculation group in the semantic model with seven time-series calculations based on both Gregorian and fiscal calendar periods. When I generated the date dimension table, I added Fiscal Year and Fiscal Period columns using the 445 fiscal period standard with the fiscal year starting in July. As you can see in this cross tab visual (or whatever it is called in Tableau), it works just fine and again, performance is good.
Import and Direct Lake Models
Just for kicks, I created an Import mode version of the same semantic model using the SQL analytic endpoint and treating the Fabric warehouse as a SQL Server data source for the semantic model developed using Power BI Desktop. Using Incremental Refresh, I partitioned the transaction table by month which took over an hour to process the first time through – and dimmed the lights on our F64 capacity for a short time. After that, the interactive query performance was about the same as the Direct Lake model. Using the Direct Lake model, it took just a few more seconds in both Tableau and Power BI for the data to load into memory. After that, both tools performed at about the same speed using either version of the semantic model.
What about for Tableau users who want to import data from a Fabric lakehouse or warehouse? Well, that brings us back to the “one version of the truth” philosophical discussion. They would lose the performance, security, central calculation logic and other advantages of a standardized reporting model. If a user has been granted permission to connect directly to a lakehouse or warehouse, they can copy the SQL analytic endpoint address from the Fabric service and connect to that data using the SQL Server connector in Tableau. This will circumnavigate security and the row-level security rules defined in the semantic model. Importing 5 billion rows into a workbook opens a whole new can of worms. You can import data from Fabric storage using Tableau, but just because you can doesn’t mean that you should, and that would largely defeat the reason for using Fabric in the first place.
Conclusion
Outside of any discussion about Tableau vs Power BI licensing costs, preferences or product loyalty, Tableau as an analytic reporting tool works quite well with Fabric utilizing a direct connection to the Fabric semantic model in either Direct Lake or Import storage mode. Performance is great and RLS rules all work as expected.