

In today’s fast-paced business environment, decision-makers cannot afford to wait weeks for financial reports. Real-time insights are the new gold standard – and that’s where financial dashboards and KPIs (Key Performance Indicators) come into play. They transform traditional financial reporting into dynamic, interactive tools that drive strategic decisions.
Traditional financial reporting often involves static spreadsheets, dense PDF statements, and rear-view mirror insights. While these reports are essential for compliance and historical analysis, they lack immediacy and clarity. Executives, CFOs, and operational managers need to see what is happening now – and predict what is coming.
That is where dashboards and KPIs step in, providing visual, real-time updates and performance indicators across financial dimensions like revenue, cash flow, and profit margins.
A financial analytics dashboard is a powerful tool that provides users with a comprehensive, visual representation of key financial metrics and performance indicators. It transforms complex financial data into easy-to-understand charts, graphs, and summaries, enabling quicker insights and more informed decision-making.
The EzDataMunch Financial Analytics Dashboard delivers a consolidated view of essential KPIs such as operating cash flow, current ratio, net profit margin, gross profit margin, and working capital. These metrics offer a high-level summary that helps users evaluate the organization’s financial health immediately.
Beyond tracking performance, the dashboard empowers finance teams to:
- Monitor real-time expenses, sales, and profitability
- Analyze performance trends across departments or periods
- Identify areas requiring immediate attention or corrective action
- Support strategic planning and budgeting with data-driven insights
By streamlining financial reporting and automating analysis, a financial analytics dashboard saves organizations significant time and operational costs, while enhancing decision-making speed and accuracy.
Financial analytics plays a critical role in transforming raw data into actionable insights. It empowers organizations to make smarter decisions, mitigate risks, and drive strategic growth. Below are some of the key reasons why financial analytics is important for any organization:
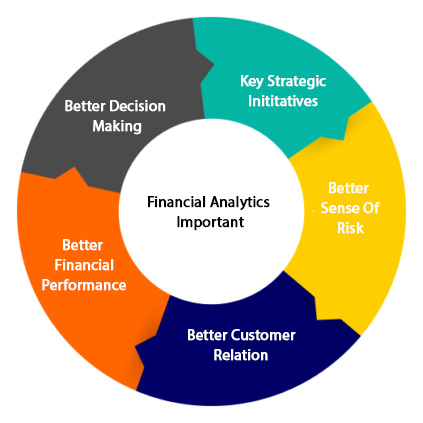
- Key Strategic Initiatives
Financial analytics enables organizations to align financial planning with strategic goals. By identifying trends, opportunities, and gaps, companies can prioritize initiatives that drive long-term growth and competitive advantage.
- Better Sense of Risk
Risk assessment is more accurate with analytics. By evaluating financial data in real-time, organizations can detect anomalies, forecast potential disruptions, and make proactive decisions to mitigate financial risks.
- Better Customer Relation
Understanding the financial behavior linked to customer segments allows businesses to tailor services, pricing, and engagement strategies. This leads to improved customer satisfaction and loyalty, which ultimately drives revenue.
- Better Financial Performance
With clear visibility into expenses, revenue streams, and profitability, financial analytics helps optimize performance. It supports cost reduction, revenue enhancement, and better resource allocation.
- Better Decision Making
Data-driven insights empower stakeholders to make informed, timely, and confident decisions. This minimizes guesswork and enhances the accuracy of financial forecasts and plans.
Define Clear Objectives: Start with the “why” – reporting for board meetings, cash flow management, or investor relations?
Choose the Right Metrics: Focus on KPIs that align with your business model and goals. Avoid vanity metrics.
Make It Visual: Use charts, gauges, and color-coding for immediate insight. Red for alerts, green for on-target metrics.
Ensure Real-Time Updates: Connect to live data sources for up-to-date reporting.
Enable Drill-Downs: Let users click into a KPI to explore underlying data – great for root cause analysis.
Automate Reporting: Schedule reports and alerts to ensure stakeholders stay informed without manual work.
Financial analytics is more than just analyzing numbers—it is about uncovering insights that drive smarter business decisions. It helps organizations understand past performance, assess current health, and forecast future outcomes. With the right financial analytics, leaders can make proactive, data-driven decisions that support growth and profitability.
Below are some essential types of financial analytics that every business should be familiar with:
Predictive Sales Analytics
Uses historical data and trends to forecast future sales, helping businesses manage demand, allocate resources, and optimize inventory for improved planning and market readiness.
Cash Flow Analytics
Tracks real-time inflows and outflows, ensuring healthy liquidity. It monitors working capital and cash cycles, helping businesses avoid shortages and support strategic investments.
Profitability Analytics
Analyzes profits by product, service, or region. Helps identify top performers, optimize pricing, reduce inefficiencies, and guide strategies that maximize overall profitability.
Value-Driven Analytics
Focuses on key business drivers like efficiency, innovation, and customer value. Aligns analytics with strategic goals to support sustainable growth and long-term performance.
Financial KPIs help to scale a company’s performance in real terms. Here are the most critical ones to include in your dashboard:
- Gross Profit Margin
Indicates how efficiently a company produces goods/services. Formula: (Revenue – Cost of Goods Sold) / Revenue
- Net Profit Margin
Measures overall profitability after all expenses. Formula: Net Income / Revenue
- Operating Cash Flow
Shows how much cash is generated from operations – not investments or financing.
- Current Ratio
Assesses liquidity by comparing current assets to liabilities. Formula: Current Assets / Current Liabilities
- Accounts Receivable Turnover
Reveals how efficiently a business collects payments. Formula: Net Credit Sales / Average Accounts Receivable
- Budget vs. Actual
Monitors financial discipline and forecasts accuracy.
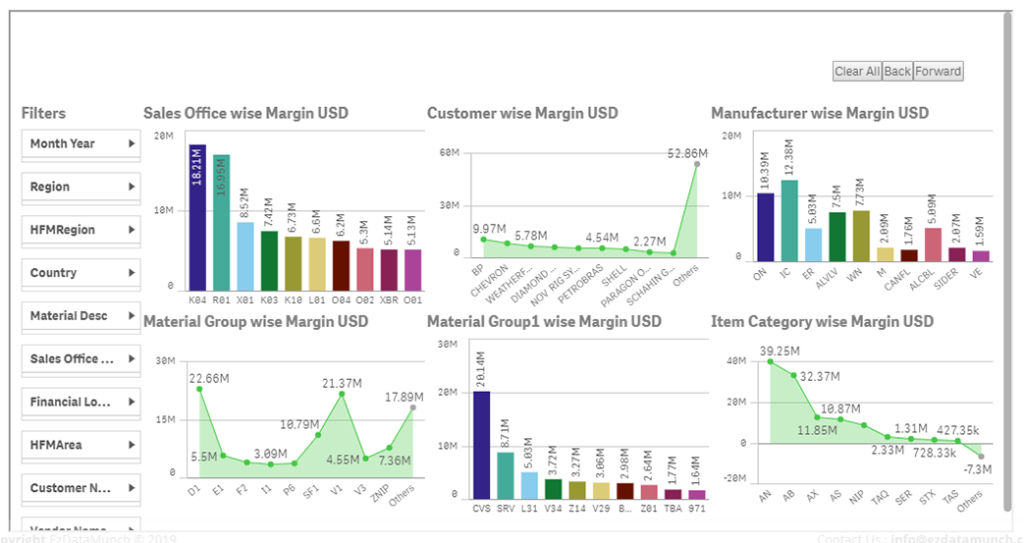
Margin Analysis
Margin analysis compares additional benefits versus costs of business activities. It helps maximize profits by analysing performance across areas like sales offices, customers, manufacturers, items, and materials through visual dashboards.
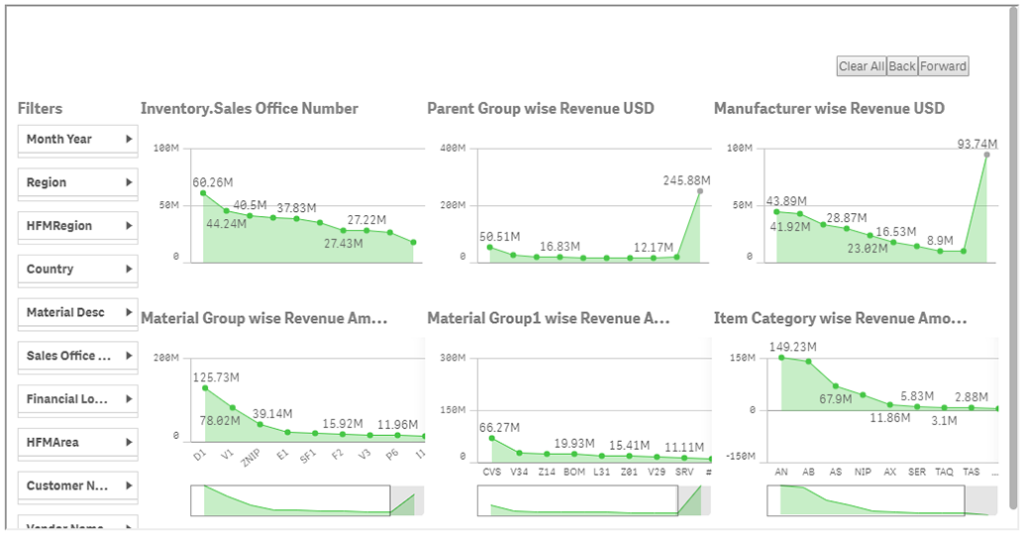
Revenue Analysis
Revenue analysis identifies key areas for growth by evaluating product performance and operational efficiency. The graph below highlights revenue insights across material groups, item groups, inventory levels, and manufacturers.