


A number of our marketing agency clients have told us they spend, on average, 2–3 days every month just wrangling data for client reports. That’s a lot of billable hours tied up in something that really shouldn’t be so manual–but that’s just my opinion.
How does that happen?
Account managers often find themselves pulling data from CRMs, ad platforms, web analytics tools, social media—you name it—and stitching it all together into one clean, reliable, and easy-to-read dashboard or report.
This consolidated view of marketing performance isn’t just a “nice to have”—it’s critical for client transparency and for drafting impactful strategies with confidence.
But surely there’s a better, faster way to do this? There is.
In this post, we’ll explore the data ingestion and processing capabilities within ClicData that help marketing agencies automate reporting, streamline operations, and scale their analytics without adding more overhead.
What’s the difference between traditional way of unifying data vs the ClicData way?
Traditionally, achieving this level of data consolidation and harmonization requires a complex stack of ETL tools, custom scripts, and dedicated development resources. This setup not only drives up operational costs but also demands ongoing maintenance and technical oversight.
ClicData offers a more efficient alternative. With our all-in-one, low-code data platform, marketing agencies can seamlessly connect to multiple data sources, automate the data transformation process, and centralize insights—all without the need for a heavy engineering lift.
The result: faster turnaround, reduced overhead, and more time to focus on delivering value to clients.
Step 1: Gathering data – how do I connect data with ClicData?
We already stated it, your client data is all over the place. To make sense of it (and actually use it), you need smart ways to bring everything into one central spot.
That’s where ClicData comes in, with multiple ingestion methods built to handle the real-world needs of modern marketing teams:
- Native Connectors for Marketing & Social Platforms: Marketing campaigns often span multiple channels—Meta Ads, Google Ads, Google Analytics, LinkedIn, TikTok, and more. ClicData provides native connectors for all major advertising and analytics platforms, allowing agencies to automatically sync performance data directly into their ClicData data warehouse with minimal setup.
- Email-Based Data Ingestion: For scenarios where data is delivered via scheduled email—such as CSV, Excel, or other delimited file attachments—ClicData can automatically retrieve and process these files. Whether sent by internal teams or generated by other platforms, this method ensures that even manually distributed reports are integrated into your dashboards without manual uploads.
- Web Service & REST API Integration: Many third-party tools offer REST APIs for external data access. ClicData’s Web Service connector enables seamless integration with virtually any RESTful API, making it easy to pull JSON data from niche tools or proprietary systems that aren’t covered by native connectors.
You might not need all of these methods right now, but having the flexibility means you’re set up for whatever comes next.
3 methods of importing and handling data with ClicData
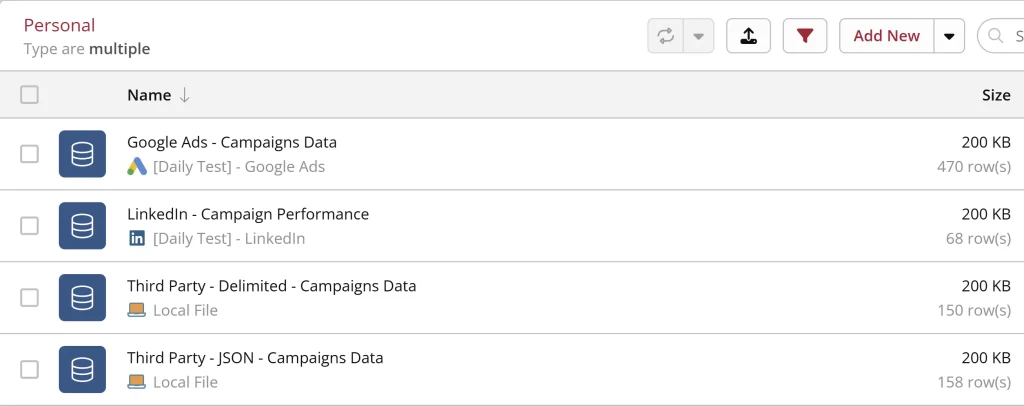
We’ve pulled together a few real-world data examples all with different formats, sources, and quirks.
1. Using native connectors (e.g. Google Ads, LinkedIn Ads):
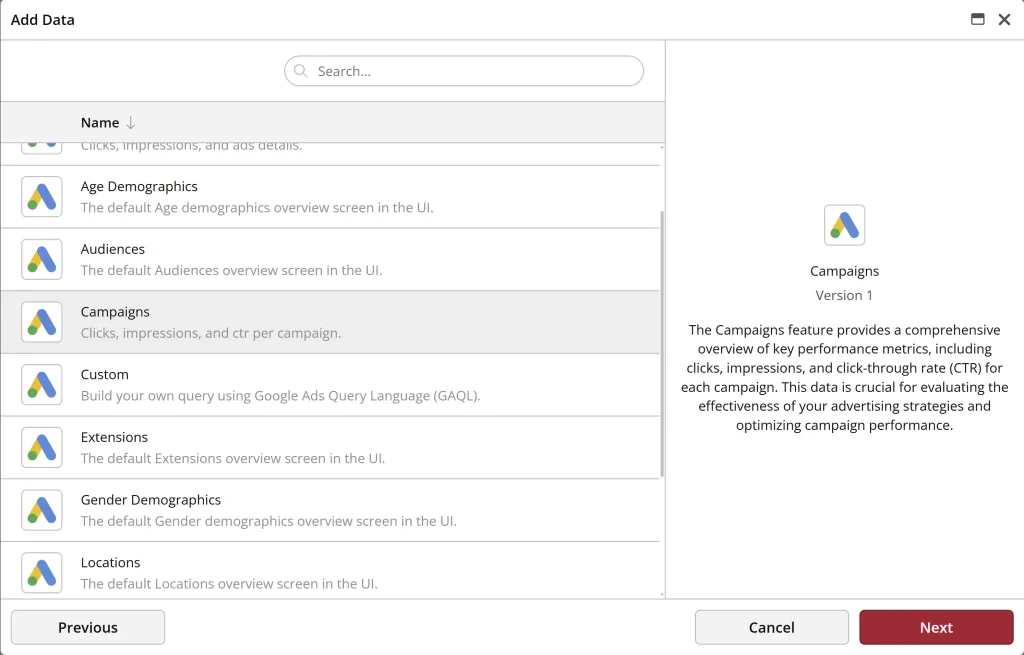
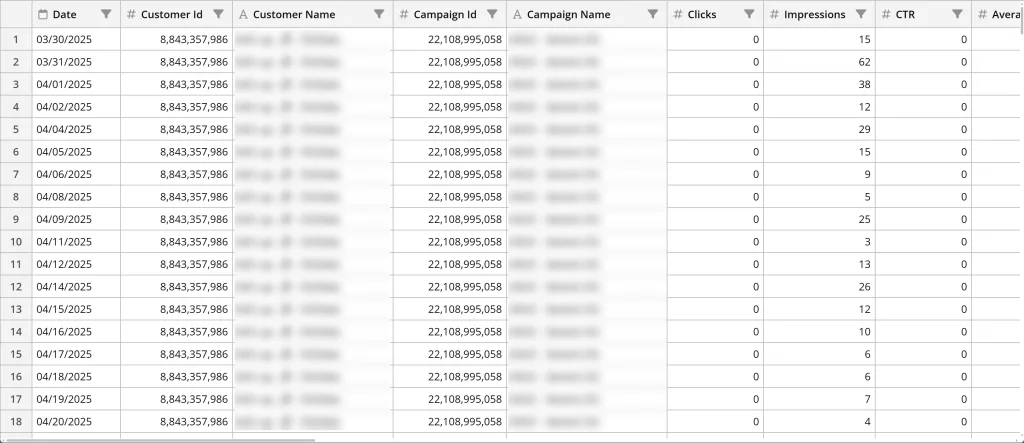
Our native connectors come with something called Smart Views. What’s a Smart View, you ask? Think of it as a pre-formatted, ready-to-use data table, like the one below.
For example, using the Google Ads connector, you could bring in one table showing your Campaigns, Campaign Groups, and Ads, and another showing engagement metrics broken down by date, region, device, etc. No need to piece it together yourself.
2. Uploading a Flat File:
Of course, you can also upload flat files in XLSX, CSV formats, the usual suspects. Very handy when you need to combine things like budget and targets with actuals, or when clients send over raw data exports.
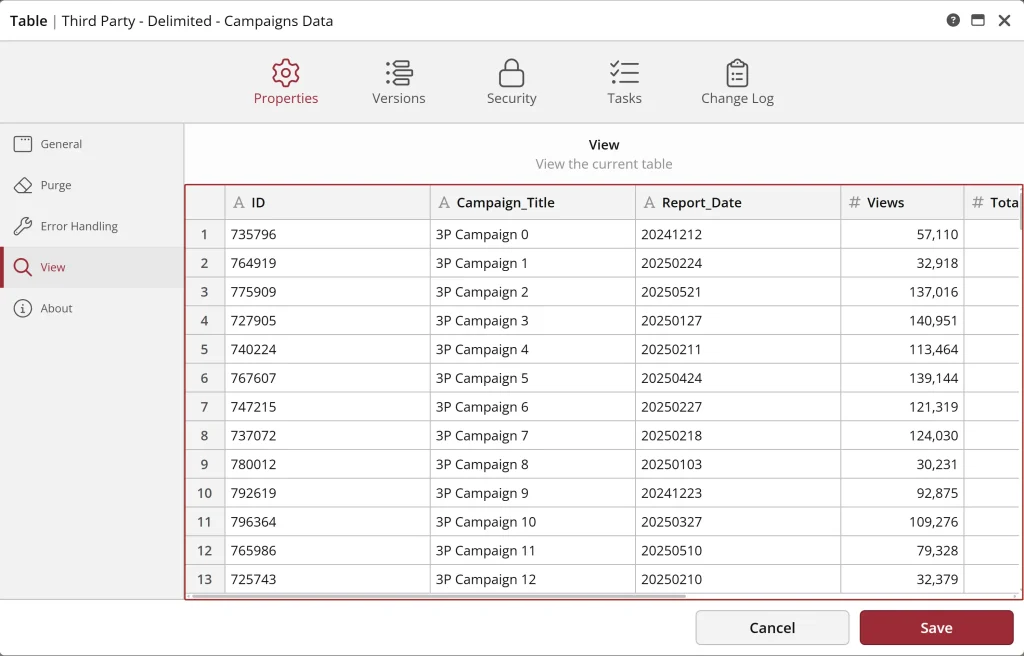
In the example below, we’re working with a file exported from an ad platform:
Report Name: Q2 Campaign
Performance Summary
Report Generated On: 5/21/2025
Prepared By: External Analytics Tool
| ID | Campaign_Title | Report_Date | Views | Total_Clicks | CTR | Ad_Spend | Form_Submissions |
| 790663 | 3P Campaign 0 | 20250501 | 123833 | 1126 | 0.91% | 334.19 | 75 |
| 772358 | 3P Campaign 1 | 20250501 | 53721 | 2208 | 4.11% | 530.4 | 65 |
| 751309 | 3P Campaign 2 | 20250501 | 67081 | 568 | 0.85% | 567.28 | 25 |
| 741289 | 3P Campaign 3 | 20250501 | 37596 | 3485 | 9.27% | 319.12 | 44 |
ClicData’s file ingestion module lets you skip any non-data rows and start reading from the actual column headers.
So even if the file’s a bit messy, your import stays clean and accurate:
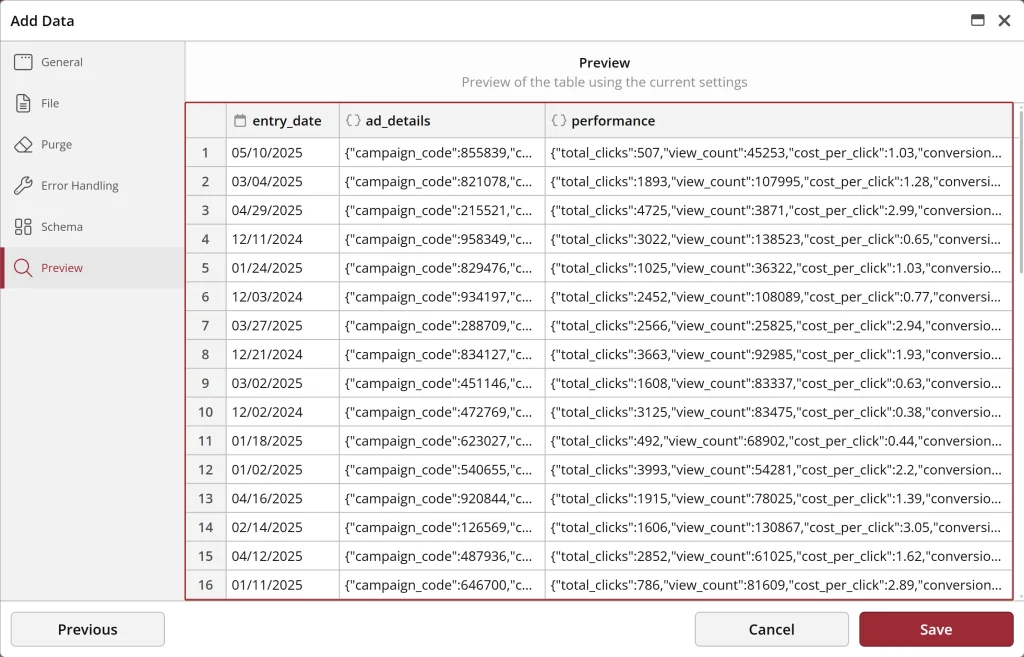
3. Importing a JSON File
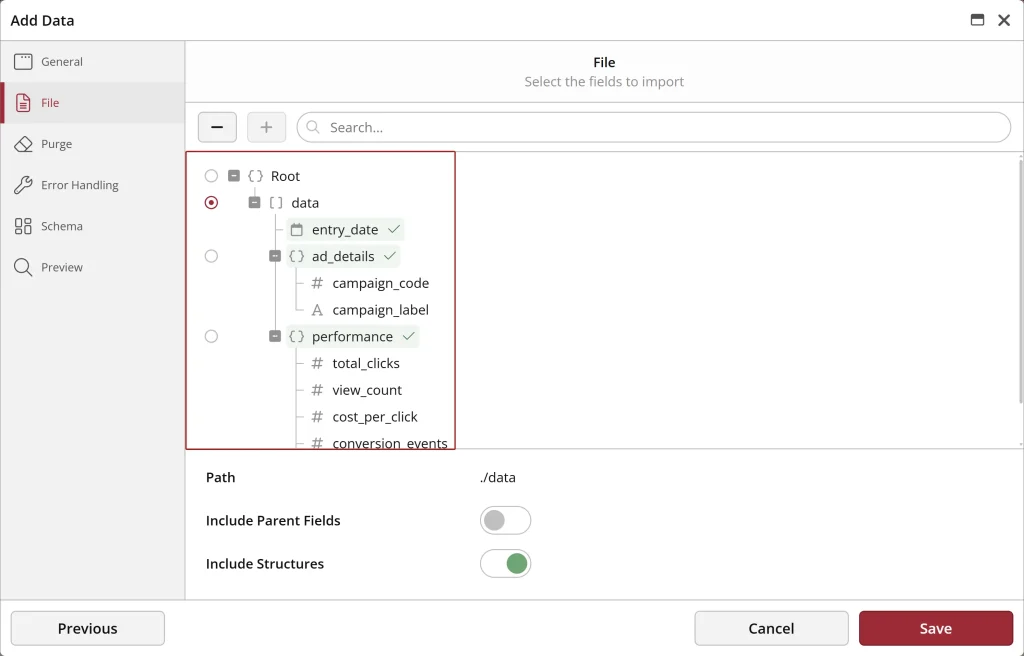
Sometimes, your data comes in as JSON, usually from APIs or custom-built tools. Could be lead data from a bespoke CRM or performance metrics from a niche ad platform.
In this particular example, the structure’s a bit more layered, so we’ll apply some extra processing in the Data Flow. More on that shortly.
{
"data":
[
{
"date": "2025-01-23",
"campaign":
{
"id": "cmp_97586",
"title": "3PJ Campaign 0"
},
"metrics":
{
"impressions": 146307,
"clicks": 398,
"ctr": "0.27%",
"spend": 799.15,
"conversions": 74
}
}
]
}ClicData’s Web Service connector supports full parsing of nested JSON using node selection and automatic flattening, so even complex structures can be turned into clean, usable tables with minimal setup.
Congrats, your data’s centralized! And hey, look at that… it only took 20 minutes. Not bad for something that used to eat up half a day.
What’s next now that all the data’s in?
It’s time to drop your tables into a Data Flow. This is where we clean things up: align schemas, standardize formats, and prep everything for consistent, unified reporting.
Let’s walk through how each table is cleaned and transformed within the Data Flow to create a consistent, analysis-ready dataset.

Want to take a short break?
Discover how the marketing agency Marketri uses ClicData with their clients. They do lots of things–LinkedIn performance review, funnel conversions tracking, website analytics… Read on!
Step 2: Handling data – how do I unify data from multi-sources?
That’s where ClicData’s Data Flow comes in. It’s our drag-and-drop pipeline builder for cleaning and processing data. Data engineers love it for its flexibility, the intuitive UI, and the fact that it gives you a clear, visual map of every step in your data pipeline.
In this use case, we’re keeping it simple: we’ll standardize each dataset individually before merging them into a single, unified source of truth.
While Data Flow has a ton of data transformation tools for more advanced use cases, we only need a few core nodes to get the job done here:
Input Table (required)
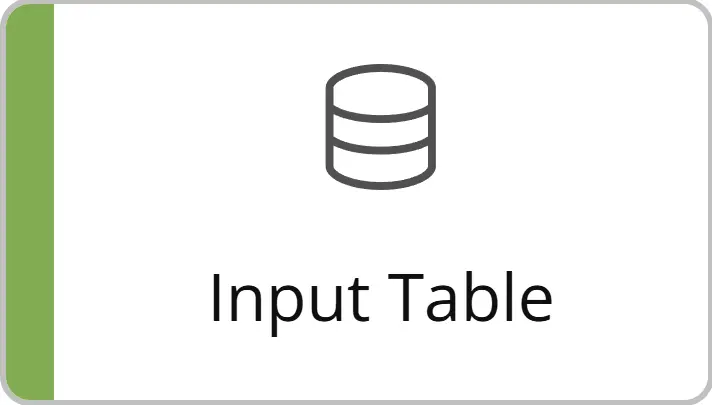
This is the entry point. Each dataset comes into the Data Flow through its own Input Table node.
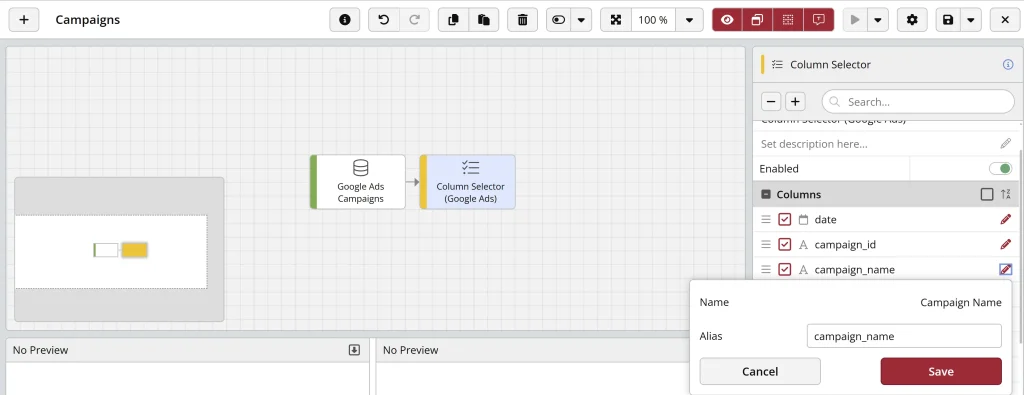
Column Selector
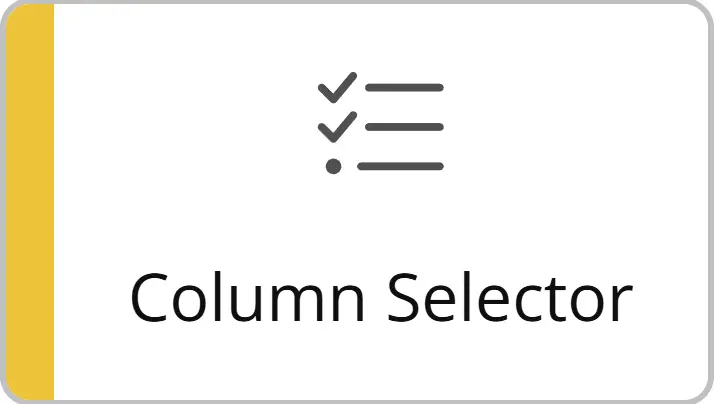
This one helps us clean up and align the structure. You can keep, rename, or reorder columns to match across sources.
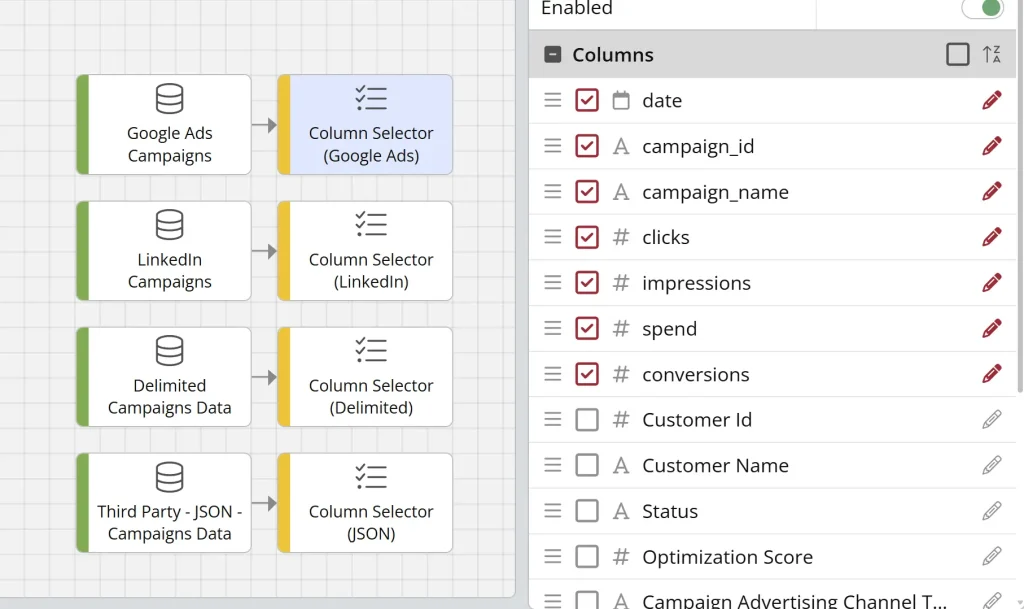
For example, Google Ads brings in a ton of fields, most of which don’t exist in our other datasets. So we trim it down to just the shared fields for consistency.
We’ll do the same across all data sources to create a common schema:
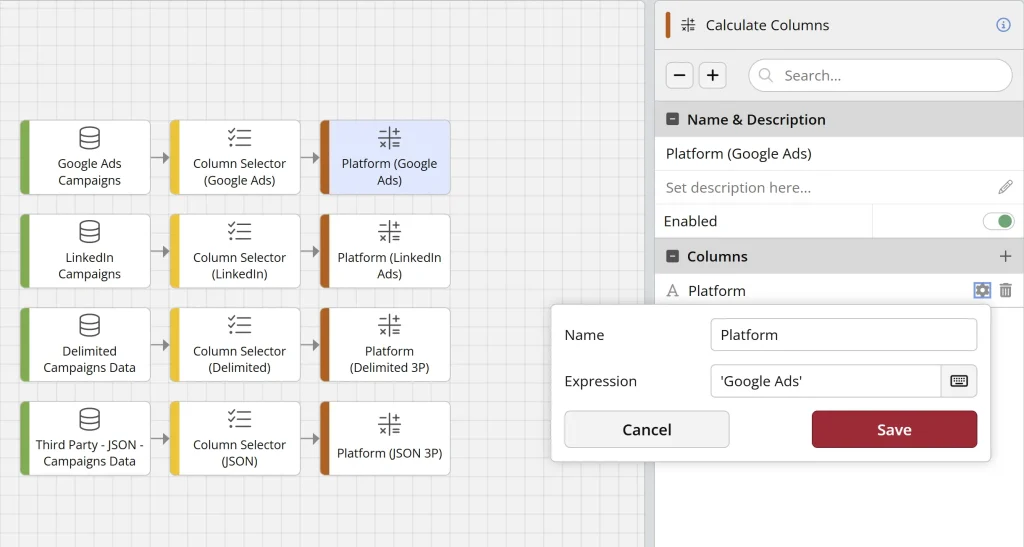
Calculated Columns

Want to tag each row with its platform source? This is where we do it. We’ll add a static value like “Google Ads” or “LinkedIn Ads” so dashboards and reports can easily group or filter by source.
Transform Data
This one’s for adjusting existing values using T-SQL. In our case, the CSV file’s Report_Date field comes in as a numeric string (e.g., 20250501). To convert it into a proper date format, we use this expression:
DATEFROMPARTS(LEFT([date],4),SUBSTRING([date],5,2),RIGHT([date],2))
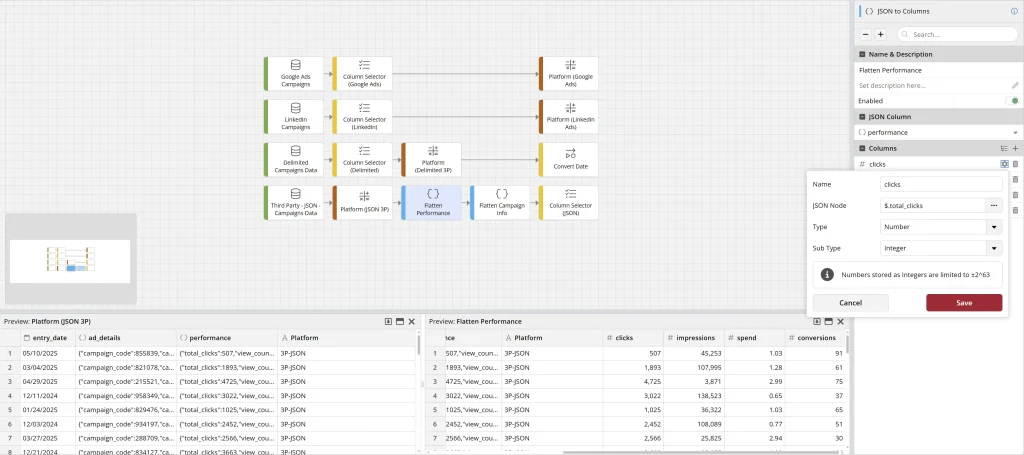
JSON to Column

This node is unique to the JSON dataset. Since the data contains nested objects, we use this node to flatten and extract the relevant fields. It also allows you to assign names and data types to the new columns, minimizing the need for further standardization.
In our case, we use two sequential JSON to Columns nodes: one to parse campaign-level attributes and one for the metrics. This gives us a flat, well-structured table aligned with our other sources.
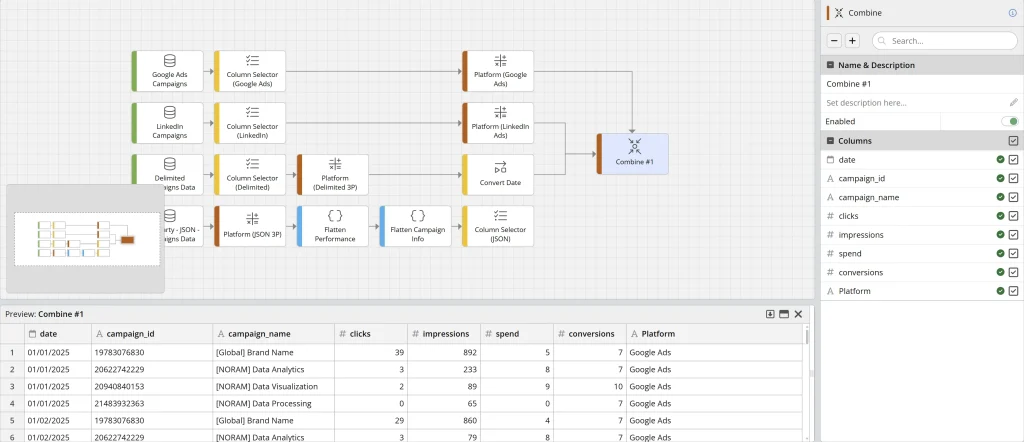
Combine
After each dataset has been cleaned and standardized, we use the Combine node to… well, combine them. Since the schemas have already been aligned via earlier steps, this is a straightforward join: simply select all relevant columns and consolidate them into a single unified output.
Output Table (required)

And just like that, we’ve cleaned up the core fields across all datasets and made them play nicely together 👍
Step 3: Executing the flow. How do I run a Data Flow?
One click. “Run the Data Flow” and voila, you’ve got your unified dataset:
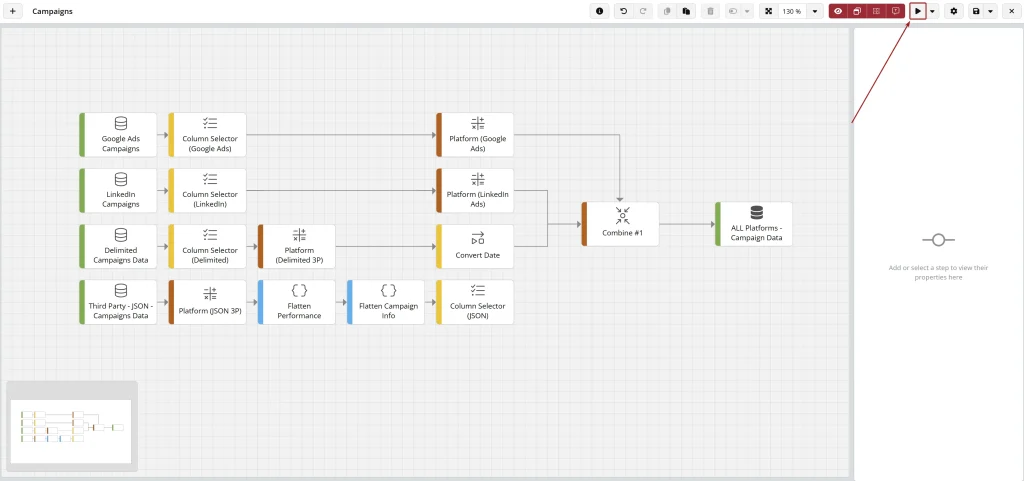
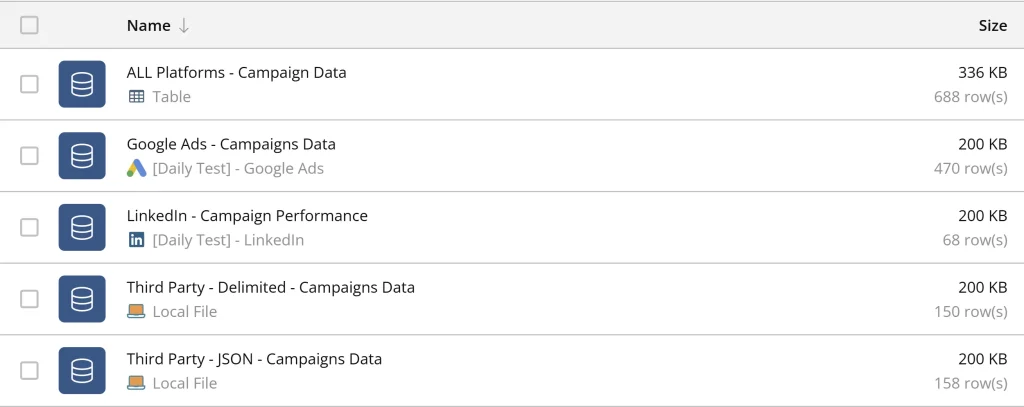
The output table “ALL Platforms – Campaign Data” becomes your go-to source of truth for:
- Building dashboards and visualizations
- Tracking KPIs across multiple platforms
- Exporting clean, client-ready reports (or sharing with internal teams)
Turning fragmented marketing data into clear KPIs in just 20 minutes
Marketing data is messy—we get it. It’s spread across CRMs, ad platforms, analytics tools, and spreadsheets. But trying to pull it all together manually? That’s a time suck, and it doesn’t scale.
Well, not anymore.
ClicData is designed to give agencies a smarter way to work. Flexible data ingestion, a visual, low-code Data Flow builder, and everything you need to transform scattered inputs into a single, reliable dataset.
Now you can skip the clunky workflows, ditch the endless spreadsheets, and get straight to the insights your clients actually care about. Whether you’re importing flat files, tapping into native connectors, or working with custom APIs, ClicData helps you clean, align, and combine it all, fast.
The result? Reports that are accurate, automated, and way less painful to produce. And hey, you get your time back.
Ready to see it in action? Two options.
If you’re the “let me roll up my sleeves and try it myself” type, jump right in with a free trial and start exploring.
Or, you’re a “show me how it’s done” type, you can get a personalized tour of the platform based on your agency needs.
Either way, your better reporting process starts here 😉